GAMES Webinar 2021 – 189期(可视化专题) | Tong Ge (Shandong University), Keke Wu (University of Colorado Boulder)
【GAMES Webinar 2021-189期】(可视化专题)
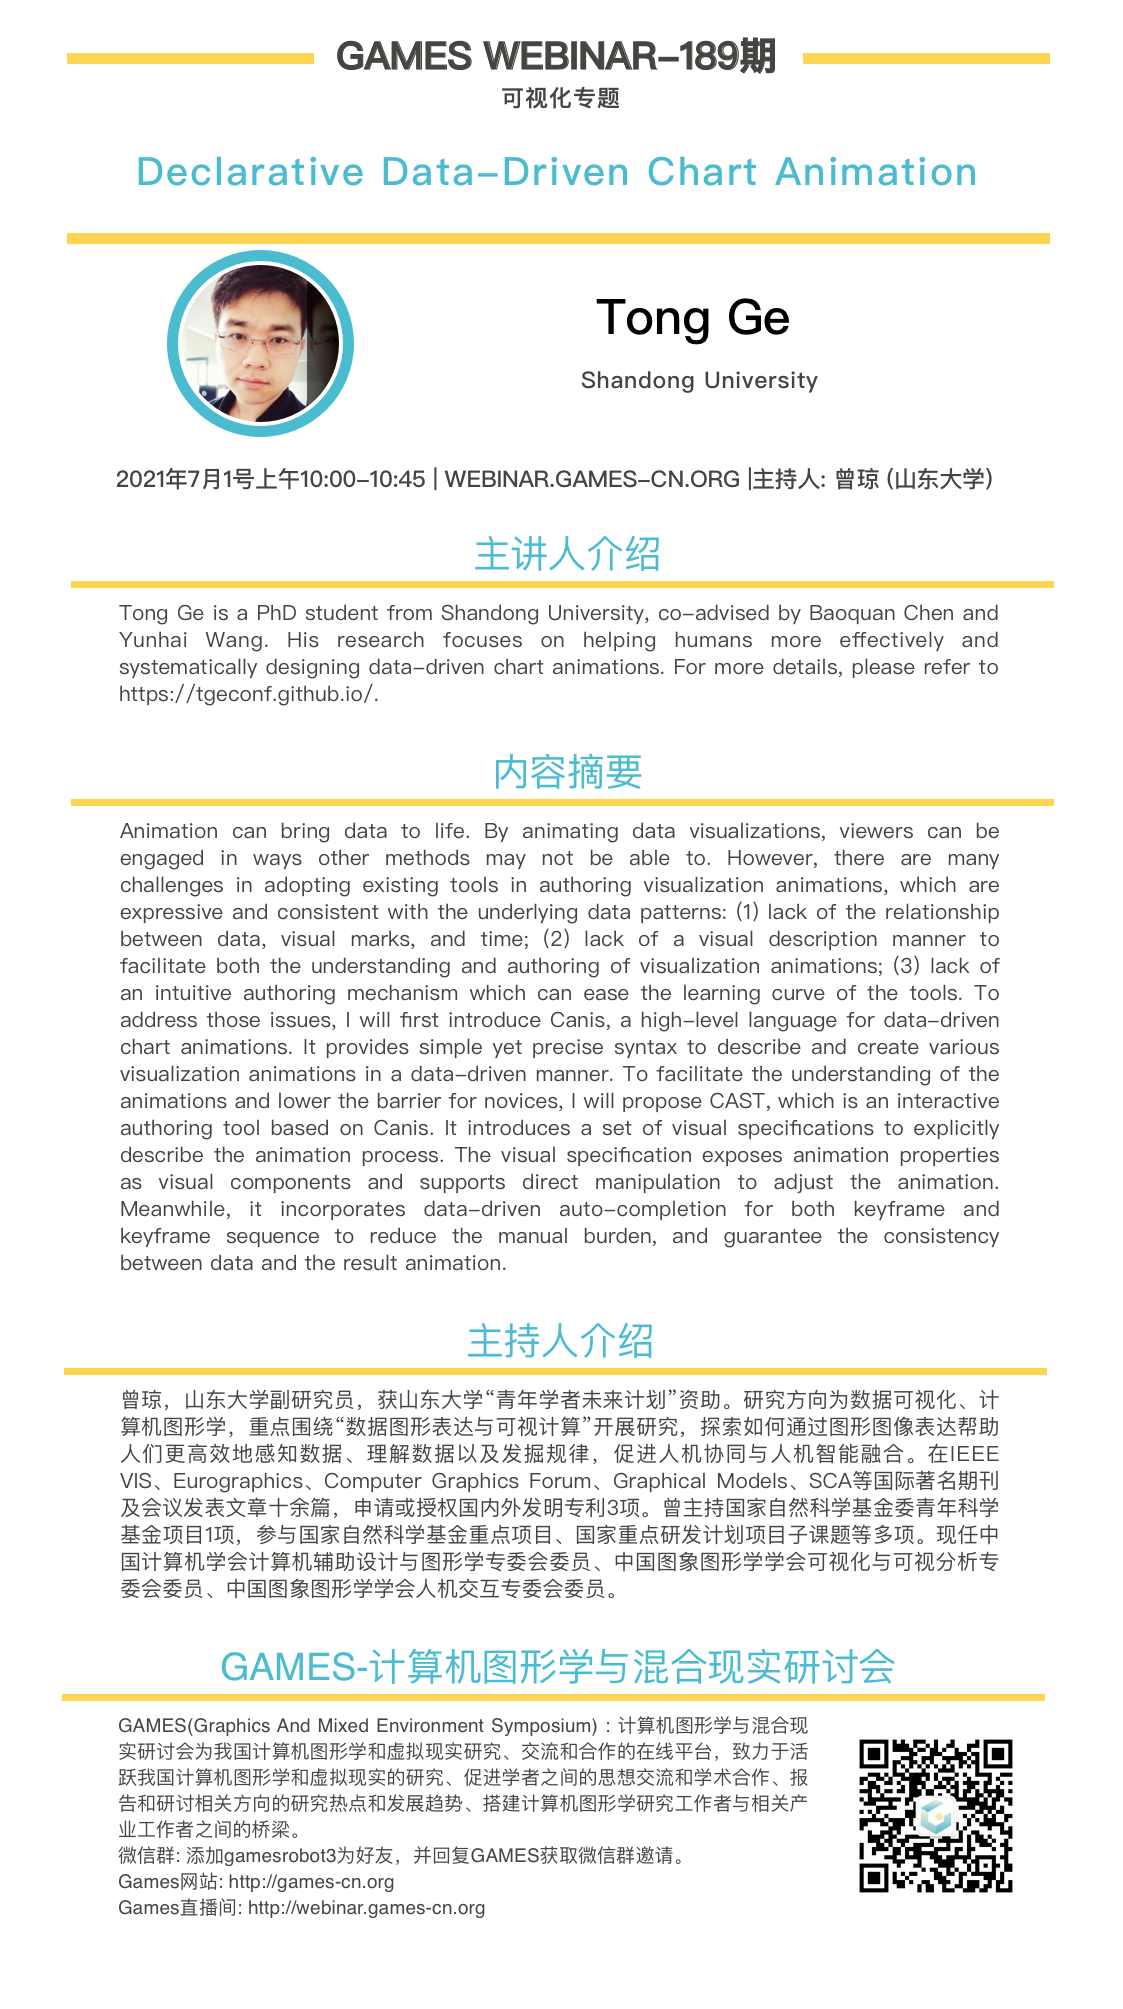
报告嘉宾1:Tong Ge (Shandong University)
报告时间:2021年7月1号星期四上午10:00-10:45(北京时间)
报告题目:Declarative Data-Driven Chart Animation
报告摘要:
Animation can bring data to life. By animating data visualizations, viewers can be engaged in ways other methods may not be able to. However, there are many challenges in adopting existing tools in authoring visualization animations, which are expressive and consistent with the underlying data patterns: (1) lack of the relationship between data, visual marks, and time; (2) lack of a visual description manner to facilitate both the understanding and authoring of visualization animations; (3) lack of an intuitive authoring mechanism which can ease the learning curve of the tools. To address those issues, I will first introduce Canis, a high-level language for data-driven chart animations. It provides simple yet precise syntax to describe and create various visualization animations in a data-driven manner. To facilitate the understanding of the animations and lower the barrier for novices, I will propose CAST, which is an interactive authoring tool based on Canis. It introduces a set of visual specifications to explicitly describe the animation process. The visual specification exposes animation properties as visual components and supports direct manipulation to adjust the animation. Meanwhile, it incorporates data-driven auto-completion for both keyframe and keyframe sequence to reduce the manual burden, and guarantee the consistency between data and the result animation.
讲者简介:
Tong Ge is a PhD student from Shandong University, co-advised by Baoquan Chen and Yunhai Wang. His research focuses on helping humans more effectively and systematically designing data-driven chart animations. For more details, please refer to https://tgeconf.github.io/.
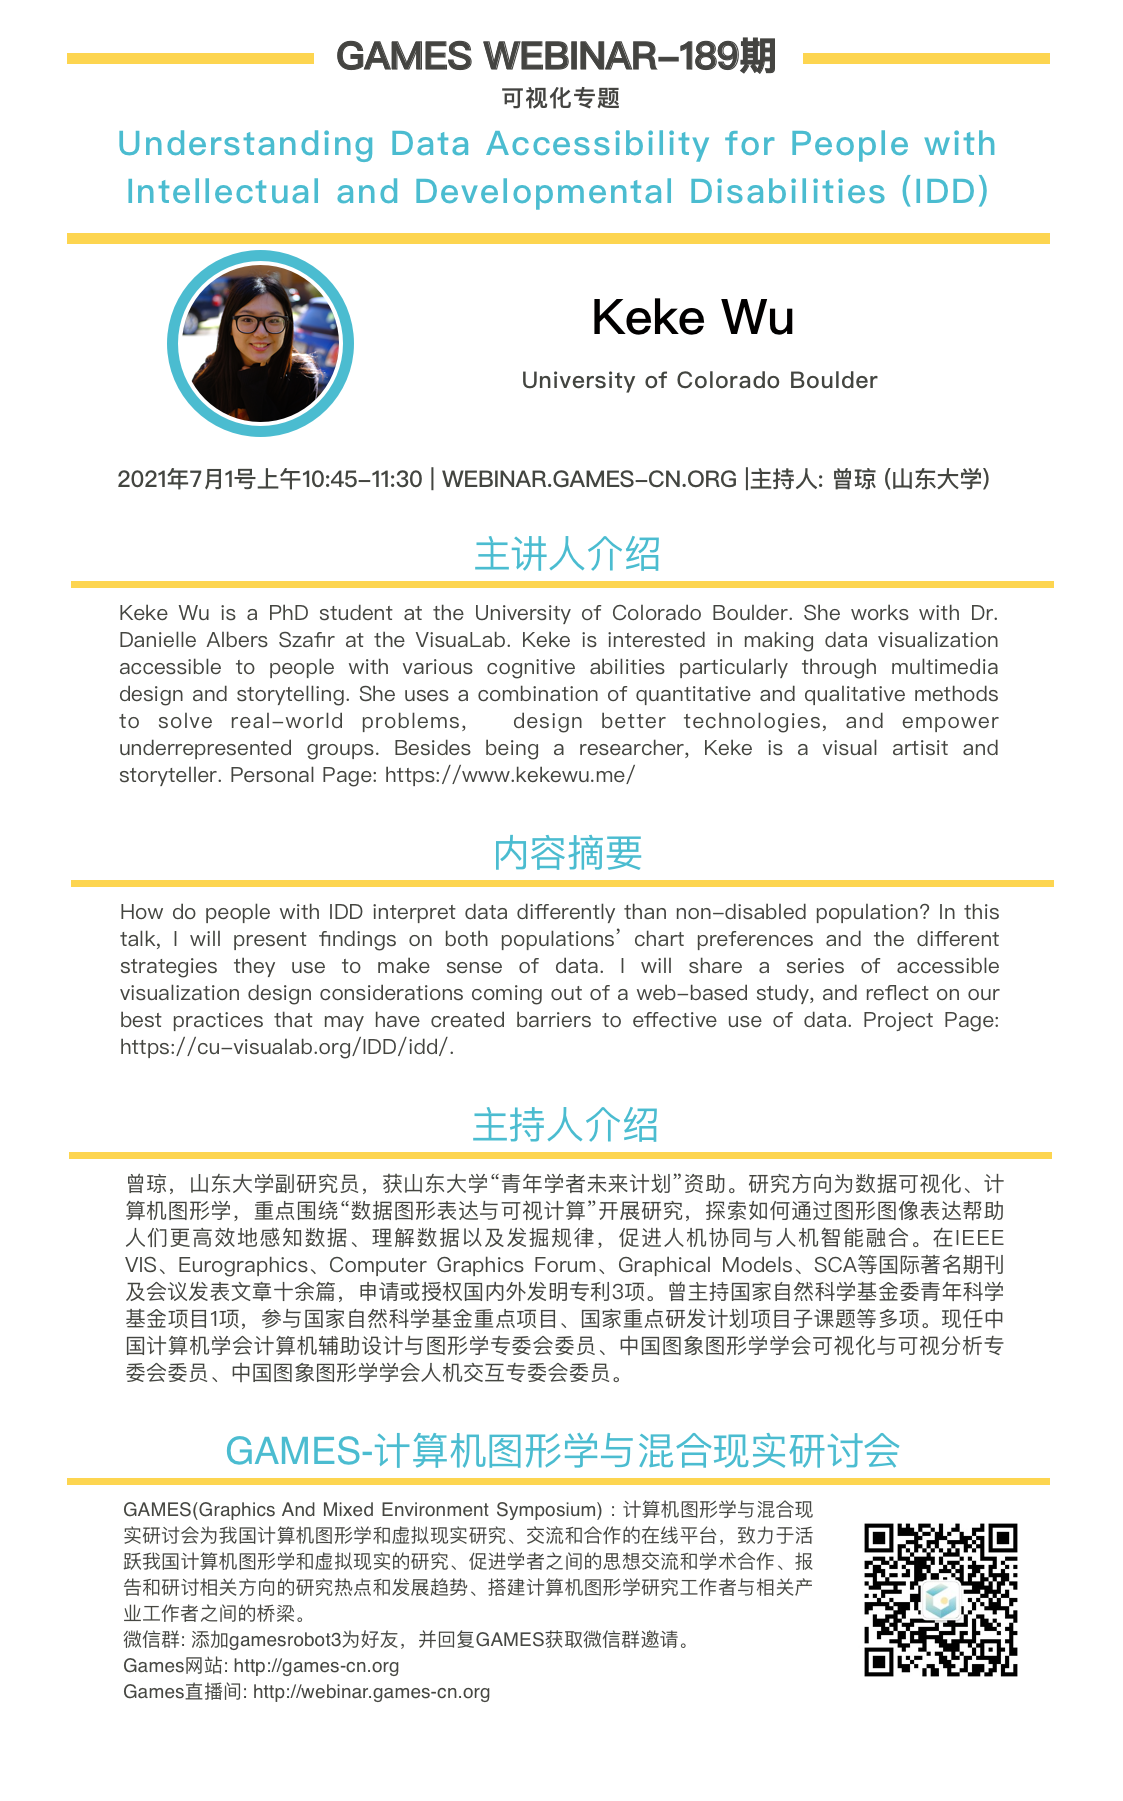
报告嘉宾2:Keke Wu (University of Colorado Boulder)
报告时间:2021年7月1号星期四上午10:45-11:30(北京时间)
报告题目:Understanding Data Accessibility for People with Intellectual and Developmental Disabilities (IDD)
报告摘要:
How do people with IDD interpret data differently than non-disabled population? In this talk, I will present findings on both populations’ chart preferences and the different strategies they use to make sense of data. I will share a series of accessible visualization design considerations coming out of a web-based study, and reflect on our best practices that may have created barriers to effective use of data. Project Page: https://cu-visualab.org/IDD/idd/.
Keke Wu is a PhD student at the University of Colorado Boulder. She works with Dr. Danielle Albers Szafir at the VisuaLab. Keke is interested in making data visualization accessible to people with various cognitive abilities particularly through multimedia design and storytelling. She uses a combination of quantitative and qualitative methods to solve real-world problems, design better technologies, and empower underrepresented groups. Besides being a researcher, Keke is a visual artisit and storyteller. Personal Page: https://www.kekewu.me/
主持人简介:
曾琼,山东大学副研究员,获山东大学“青年学者未来计划”资助。研究方向为数据可视化、计算机图形学,重点围绕“数据图形表达与可视计算”开展研究,探索如何通过图形图像表达帮助人们更高效地感知数据、理解数据以及发掘规律,促进人机协同与人机智能融合。在IEEE VIS、Eurographics、Computer Graphics Forum、Graphical Models、SCA等国际著名期刊及会议发表文章十余篇,申请或授权国内外发明专利3项。曾主持国家自然科学基金委青年科学基金项目1项,参与国家自然科学基金重点项目、国家重点研发计划项目子课题等多项。现任中国计算机学会计算机辅助设计与图形学专委会委员、中国图象图形学学会可视化与可视分析专委会委员、中国图象图形学学会人机交互专委会委员。
GAMES主页的“使用教程”中有 “如何观看GAMES Webinar直播?”及“如何加入GAMES微信群?”的信息;
GAMES主页的“资源分享”有往届的直播讲座的视频及PPT等。
观看直播的链接:http://webinar.games-cn.org